Phase diagram for Water
1 2016-05-11T10:26:40+00:00 Frank Fueten dee05431475b87c68ebf15bbea4bfeac11808e9e 16 1 A special, highly customized version with mixed references to Norse mythology and Game of Thrones Please note, in the blue is Thor, getting rid of Frost Giants. plain 2016-05-11T10:26:40+00:00 Frank Fueten dee05431475b87c68ebf15bbea4bfeac11808e9eThis page is referenced by:
-
1
media/floarting ice.jpg
2016-05-09T12:46:04+00:00
Physical states of water
28
image_header
2016-07-25T09:54:49+00:00
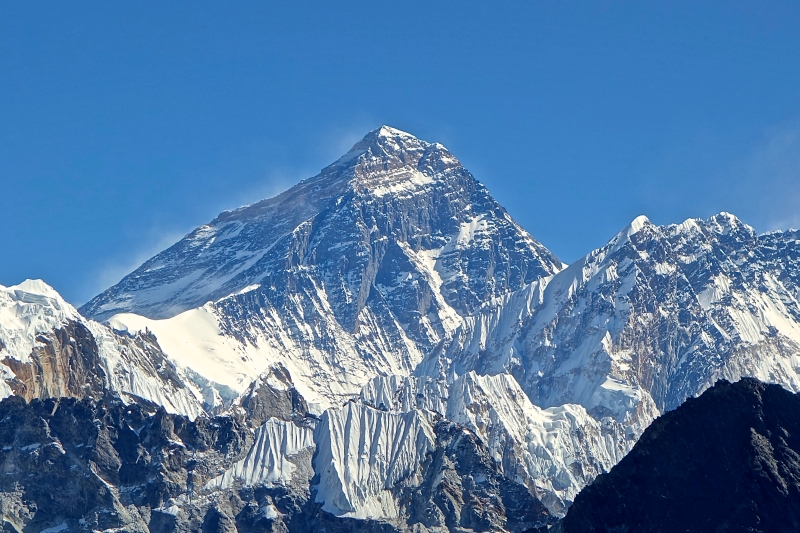
We all know that H2O can exist as water, ice and vapour (steam). These three states are referred to as physical states of matter. These states depend on physical parameters such as temperature and pressure. At sea level on the surface of the Earth, regular pure water freezes to form ice at 0°C and boils (turns to vapour) at 100°C. When water freezes or evaporates, it changes its state. But the temperature at which these changes of state take place depends on the pressure that is exerted on the water surface by the atmosphere (called atmospheric pressure). Atmospheric pressure is the weight of the column of air acting on a given surface and it increases with increasing height of the column of air. At Earth’s sea level the atmospheric pressure is 1 atmosphere (atm), 1.013 bars or 101.3 kilopascals, depending on the units you want to use. At the summit of Mount Everest, the atmospheric pressure is a mere 0.337 bars (or 33.7 kilopascals). The boiling temperature of water depends on the pressure of the atmosphere above it. (One can easily think of this as molecules of water wanting to escape from the liquid into the air to vaporize. Greater air pressure makes it harder for molecules to escape the liquid and become airborne). If you were on the summit of Mount Everest and wanted to make a cup of tea, you would find that the water would boil at a mere 73°C (Note: If you decide to use the calculator in that link, enter 101.3 and 100C at the top and 33.7 for the bottom pressure).
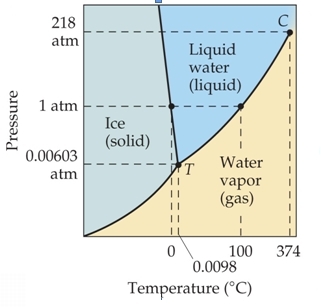
To fully characterise these changes of state with changing temperature and pressure, a phase diagram is used. A general phase diagram for water often looks like the small diagram on the right. This diagram shows the range of temperature and pressure conditions at which distinct phases of a substance can exist. Point T in this diagram is referred to as the "triple point" of water. It is the a specific temperature and pressure where three phases of water (solid, liquid, vapour) are stable. The pressure of this point is too low to be relevant to Earth (1/166 atmospheric pressure at sea level), but it is similar to the atmospheric pressure conditions on Mars. Point C is called the "critical point" of water, where temperature and pressure conditions are great enough that liquid and steam are indistinguishable from one another. The critical point is relevant to some geologic environments on Earth, such as deep sea hydrothermal vents.
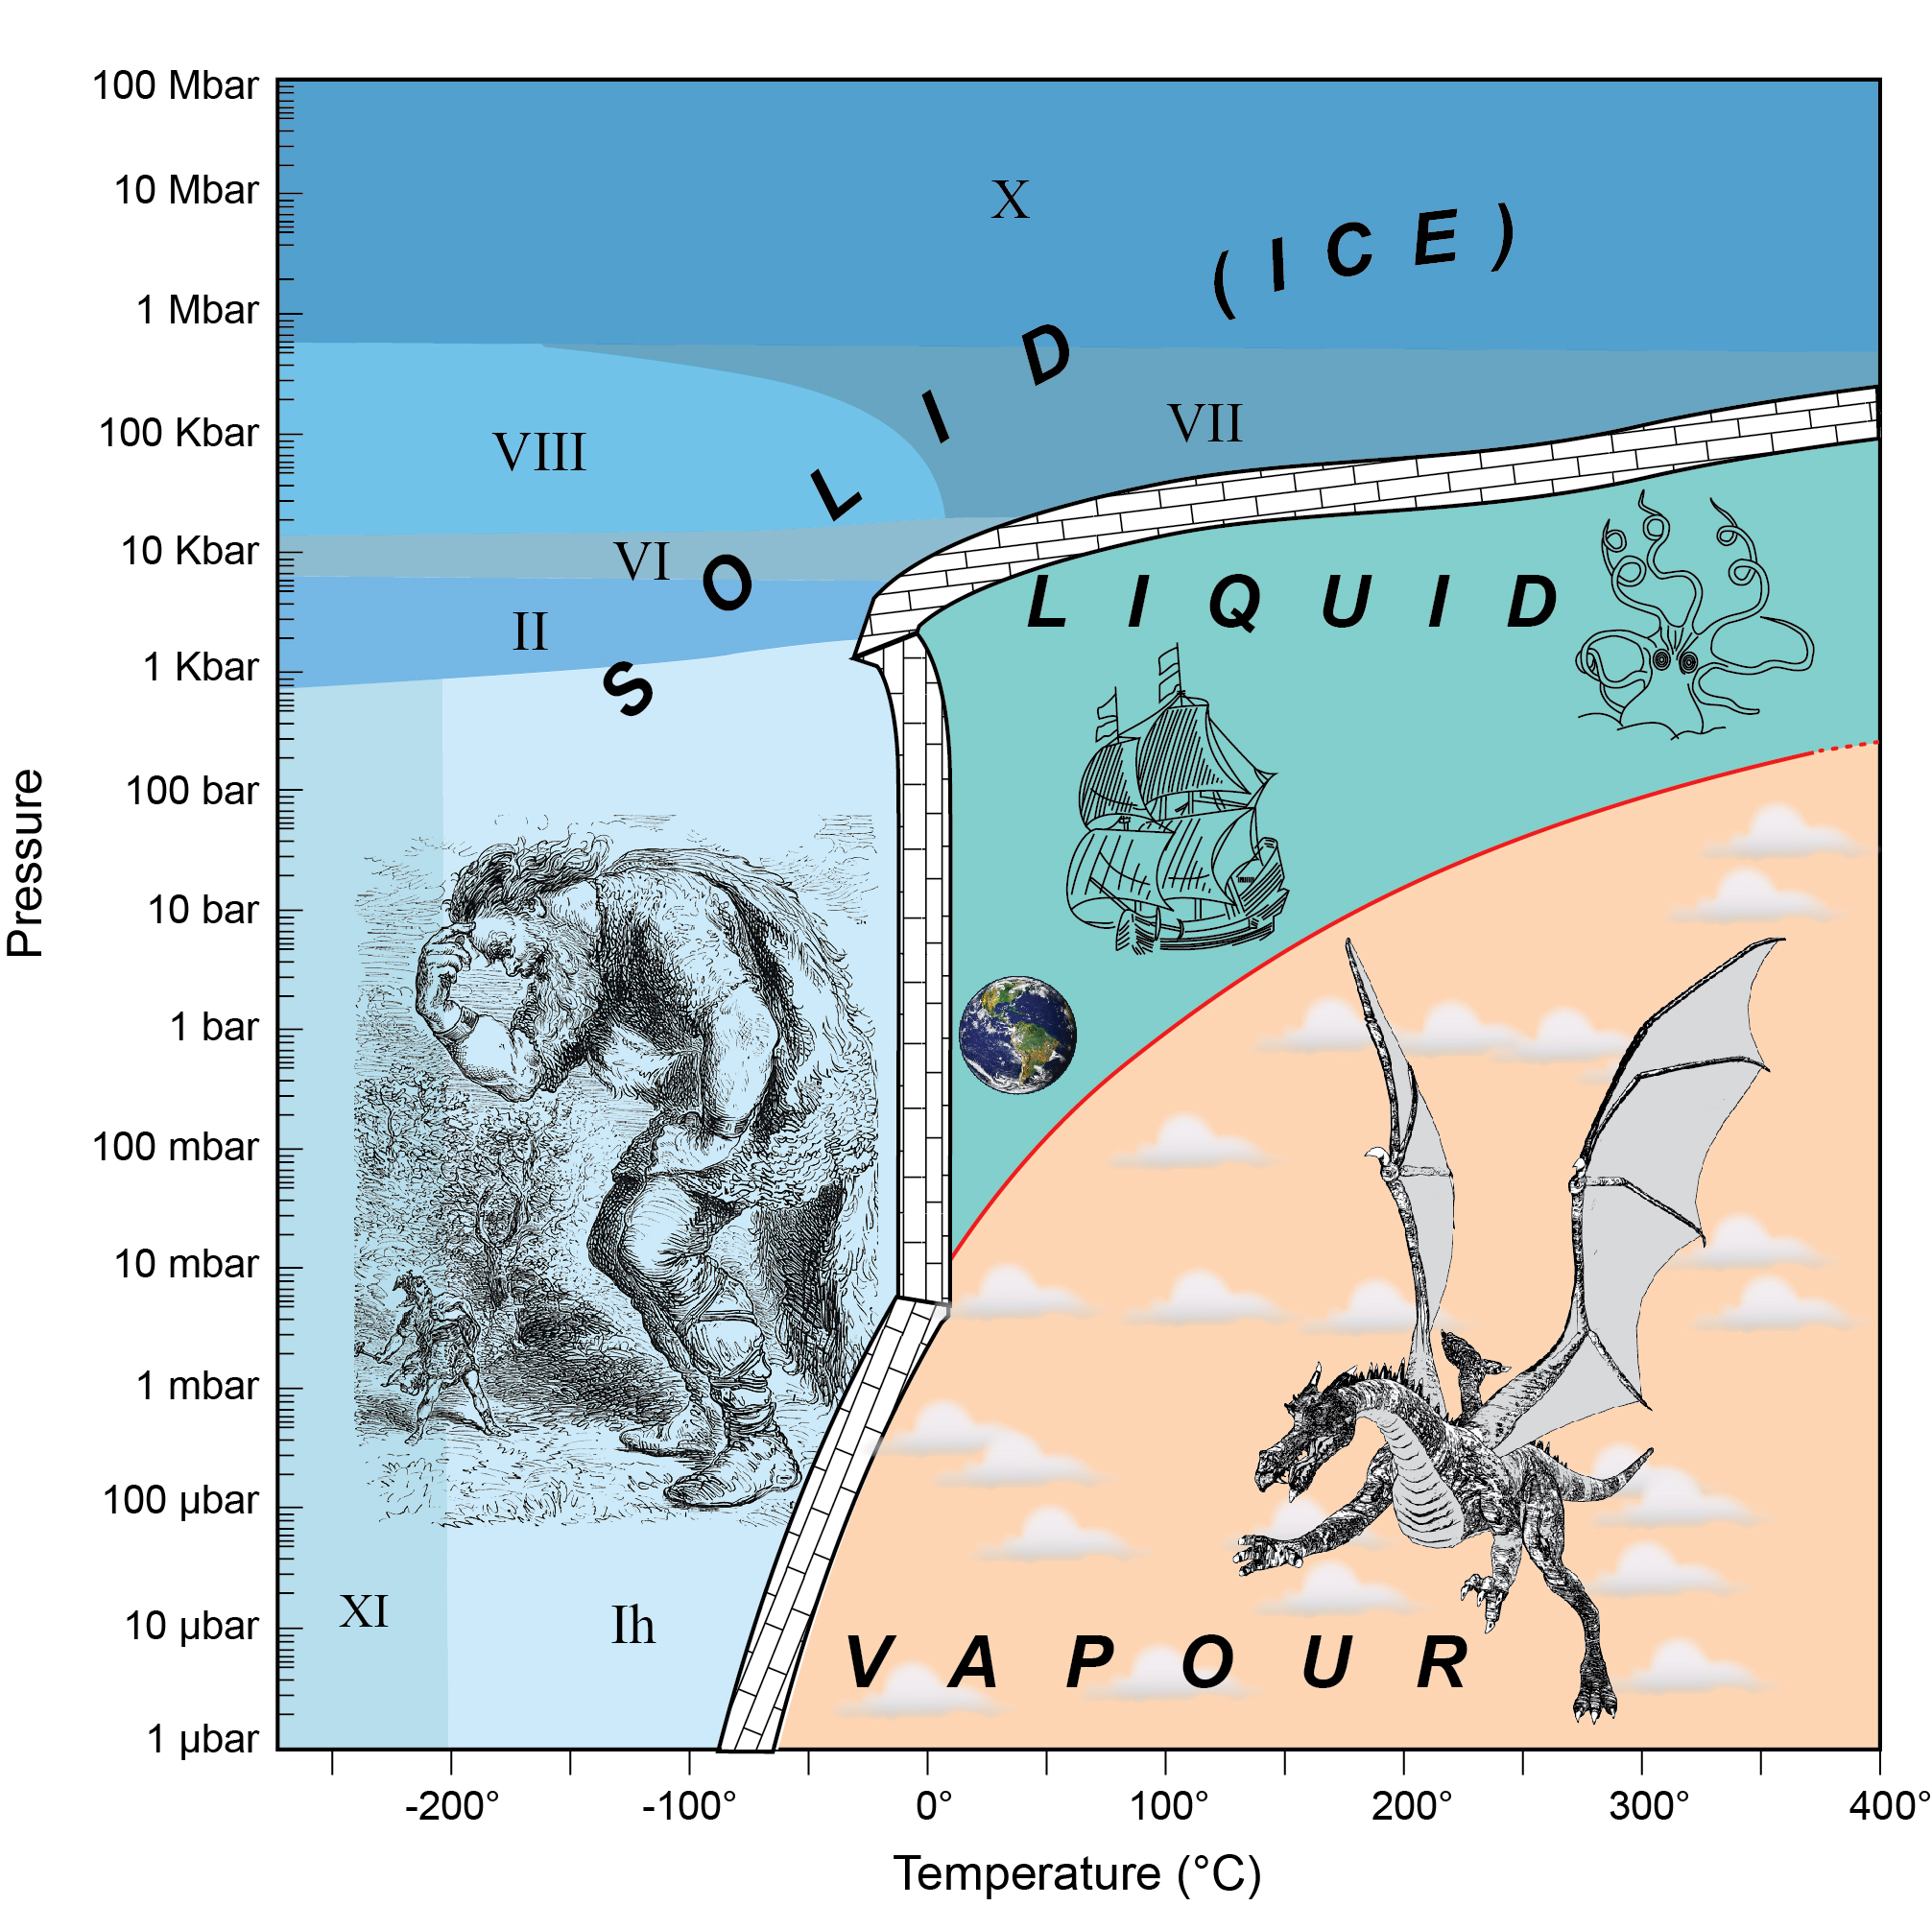
The phase diagram at right is actually simplified. For planetary systems, the real phase diagram for water is more complex. In outer space, temperatures may extend to as low as absolute zero, and pressures may be at vacuum. So, please consider the customized, slightly quirky phase diagram below at and extended scale. In this diagram we use the more commonly used unit for pressure, a bar. The difference between atmospheres and bars is minor, 1 atm = 1.01325 bar.
We'll start with the axes. You'll notice that the temperature axis goes from -273°C (or 0 K) to 400°C. The pressure axis uses a logarithmic scale which means that every increment is 10 times more (or less) than the previous. That means that our pressure differential from sea level to the top of Mount Everest (1bar to 0.3bar) barely registers on that scale. But we do need that range if we want to consider conditions in the interior ofFrostIce Giants (Neptune, Uranus). Let us consider the fields in the interior. We still have the regular three phases. Everything in shades of blue is theland of the Frost Giantsfield of solids or ices.TheWallboundary between thatlandfield, which in the simplified diagram seems to continue vertically, now curves and becomes nearly horizontal at approximately 10 Kbar (10 Kbar, or 10,000 bars would be equivalent to the pressure in an approximately 100 km deep ocean). This means the even at very high temperatures, ices can exist at very high pressures. The slightly different shades of blue indicate fields for different ices. Unlike the 32 flavours of icecreamyou can purchase in some stores on Earth, these different ices are all composed of the same ingredients, namely H2O. What differs is how the atoms are packed into the ice structure. The other thing you may notice is that the boundary between theland of dragonsvapour and the liquid is dashed beyond 374°C. This is is the critical point (point C in previous diagram), where the physical properties of liquid and vapour change and become similar. We have approximated where Earth's conditions are by placing the Earth on the diagram. Clearly conditions on this planet can vary enough for us to see all three different phases of water. But if the atmospheric pressure is low (looking at you, Mars), liquid is not stable and at very high pressures, only solids can exist.
If you like more information about how phase diagrams work, we suggest you watch this video.
-
1
media/Neptune_Uranus.jpg
2016-05-09T12:46:04+00:00
Ice Giants – Uranus, Neptune
12
image_header
2020-06-30T18:45:45+00:00
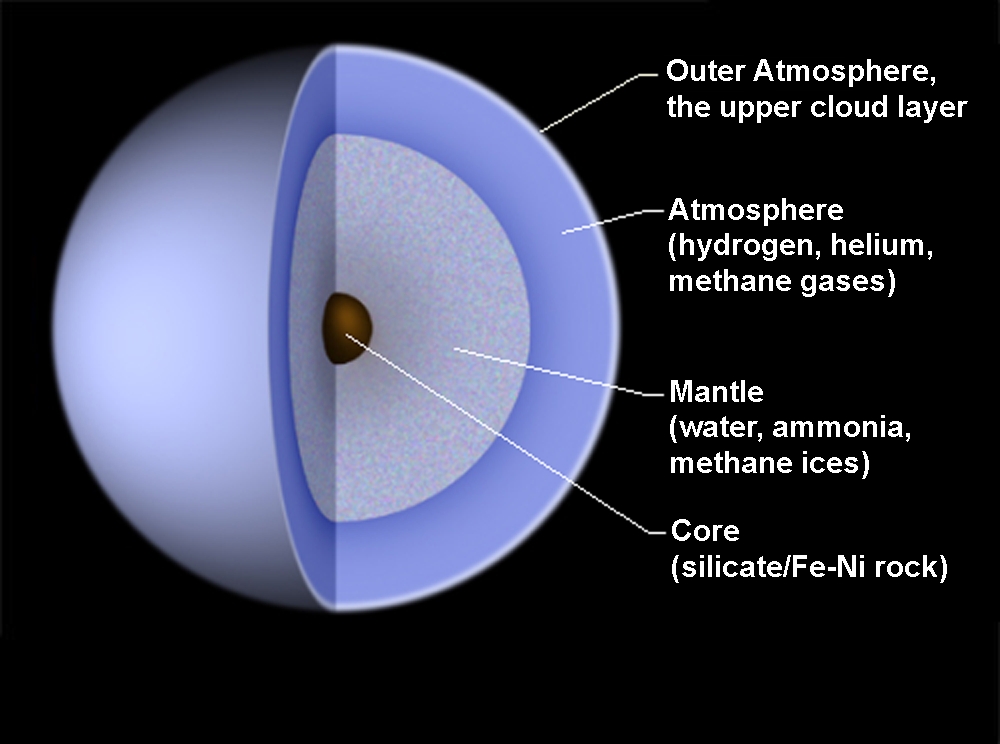
Uranus and Neptune are sometimes referred to as ice giants by astronomers. Both have similar internal structures. They possess a rocky core which is surrounded by liquid mantle and overlain by a gaseous atmosphere. The atmosphere contains some water vapour, but the bulk of the water in both planets is contained within the mantle. In addition to water, other ices in the mantle are methane and ammonia.
Even though these mantles are often referred to as icy, their interiors are very hot. The internal core temperatures of Uranus are thought to reach 5000 K (4726.85°C) and possibly a bit higher for Neptune. Core pressures of the planets are approximately double that of the Earth 7-8 Mbar (~700-800 GPa). Under these conditions the mantles are very hot dense liquids. Why then are they referred to as ices?
Look back to the phase diagram we discussed before. At high pressures and temperatures the boundary between the ice and liquid is nearly horizontal. The core pressures of 7-8 Mbar solidly within the ice-only field and even the mantles are icy mixtures. The take-away from this is that under extreme conditions substances are forced into atomic arrangements unlike anything we experience on Earth.
The icy mantles of the ice giants exhibit unusual properties and electrically are very conductive. Both Uranus and Neptune have a layer of superionic water. Despite its name, this is not a new health drink, but a theoretical phase of water under extreme heat and pressure which has properties of both a solid and a liquid.
[As an aside and not related to water, but odd things also happen to the methane. If you are interested in reading about a possible “diamond crystals that rain downwards like hailstones”, or "an ocean of liquid diamond, with floating solid 'diamond-bergs'" follow the links. Given the locations, the terrestrial diamond market is safe for the foreseeable future.]
One question remains. If there is water vapour in the atmosphere and a strange hot, liquid water ice mixture in the mantle, is there a layer of liquid water somewhere in between? This question has been addressed in a paper entitled “Liquid water oceans in ice giants”. The conclusion is that at present Neptune only has a 15% chance of a liquid ocean. That chance will increase when the Sun becomes a cool white dwarf as it ages. So, let’s check back in a few billion years.